Things I'm
building in public.
// half-finished on purpose
The portfolio shows what I've shipped and what I'm working on. This is where things are actively being made: build logs, open hypotheses, bugs I haven't fixed yet.
The work here started from a simple question: most of the tools I build professionally are for construction workers in the field. What does it look like to build without corporate IT, change management sign-offs, or the need to justify ROI before starting?
Everything here is personal and experimental. Nothing is deployed in a formal context.
All Experiments


Status: MVP built and functional. Not actively developed.
The idea: A self-contained, interactive HTML training module for fire extinguisher safety — the kind of hyper-specific, scenario-based training that usually lives in a PDF or a 45-minute classroom session nobody remembers. The goal was to make that content engaging, portable, and reusable without paying for an LMS.
What got built: A working MVP. Fire extinguisher training, interactive, functional. It works.
Why it's shelved: The MVP proved the concept and revealed the real problem. A tool like this is only valuable if you can produce content fast enough to justify the infrastructure — and the infrastructure itself has real gaps. HTML delivery creates distribution headaches (how does every worker actually access it?), security concerns, and no clean path to updates. More than that: building one module well took significant time. The safety world has hundreds of topics that could use this treatment. Without a faster content creation system — something closer to a drag-and-drop builder than a hand-coded prompt workflow — and a real distribution layer, this becomes a content factory problem disguised as a tool problem.
What worked: The concept is sound. Hyper-specific interactive training, built once and reused, is genuinely better than what most safety teams have access to. The fire extinguisher module holds up.
What revival would require: A no-code or low-code content authoring layer (drag-and-drop, digital whiteboard, something faster than HTML from scratch). A distribution system that doesn't rely on users having a specific viewing environment. More bandwidth than a side project allows.
The honest take: This idea belongs to someone who trains full-time on a narrow set of topics and needs a better delivery mechanism. That's not the right fit for where my time goes right now. If the authoring problem gets solved — by me or by someone else building the right tool — this becomes worth revisiting.
Completion rates will exceed passive formats
Task-based interaction pushes completion above 80% vs. ~50% reported for passive mandatory training.
The PASS sweep step is where users drop off
Sustained drag on mobile isn't intuitive. A progress bar alone won't fix it, the mechanic may need rethinking.
Hazard Hunt miss patterns reveal real knowledge gaps
Which hazards get missed, which safe items get false-flagged, that's diagnostic data. Tells you what prior training landed.
Wrong answers in the triangle quiz map to specific training failures
Consistent wrong selections point to conceptual gaps more useful than a pass/fail score.
Mobile drop-off is step-specific, not module-wide
The SVG touch-target bug creates device-specific failure at drag interactions, not general disengagement.
2026 Shelved
The MVP proved the concept and revealed the real constraint: content production velocity. Building one module well took significant time. The safety world has hundreds of topics that could use this treatment — but without a faster authoring system and a real distribution layer, this is a content factory problem disguised as a tool problem. HTML delivery also has no clean update path and no guarantee every worker can access it. Shelved — not broken, not abandoned, but not the right place for current bandwidth. Worth revisiting if the no-code authoring problem gets solved.
2026 Bug
The fire safety lab was returning a 404 on production because the `/lab/fire-safety/` route wasn't being served correctly by the Cloudflare Workers routing config. Added the missing route rewrite and confirmed the landing page at `lab/fire-safety/index.html` now resolves. Navigation from the lab hub to the tool works.
2026 Shipped
Moved all lab files from flat root into tiered subfolders (lab/fire-safety/, lab/construction-site/, lab/ai-chat/). Updated all internal links sitewide to absolute root-relative paths so they resolve correctly from any folder depth. Added CLAUDE.md documenting the three training modules, the open SVG touch-target bug, all five hypotheses with tracking metrics, and the build log. Gives any agent working on this project full context without reading through the HTML. Shipped a /lab-log skill for capturing session work going forward.
2026 Bug
Touch targets are sized in SVG coordinate space (viewBox 800x400) but the rendered SVG scales to fit its container. On a 390px phone, a 35px SVG touch radius is physically ~17px, too small with gloves, borderline without. Evaluating options: HTML overlay layer with percentage-positioned hit areas, or restructuring interaction out of SVG entirely.
2026 Shipped
Added pulsing indicators to Hazard Hunt. Added a fill bar to the PASS sweep step. Enlarged touch targets on pin and nozzle. Scrubbed company branding for public release. SVG scaling issue remains open.
2026 Finding
Original Hazard Hunt had no indication the scene was interactive. Users in a toolbox talk context won't explore, they need to know immediately what to do. Added pulsing indicators. Takeaway: training context demands faster time-to-first-interaction than a game or app.
2026 Shipped
Three modules: Hazard Hunt, PASS simulator, Fire Triangle quiz. Vanilla HTML/SVG/JS, zero dependencies. Forked for public release before any formal deployment. Identified UX issues on first phone test, good reminder to test on device before shipping.
Construction technology discussions exist at two extremes. The vendor pitch: "AI will transform construction", big claims, no context. The individual case study: one tool solving one problem. Neither answers the question a builder actually has: how do all of these pieces fit together across a real project?
This is an attempt to answer that question through an interactive vertical scroll experience: a high-rise building, floor by floor, showing how sensors, robotics, AR/VR, AI, and real-time data apply at each phase of construction: steel erection, metal framing, MEP rough-in, drywall, unit finishes, parking garage, excavation.
Each floor connects speculative technology to field reality. Where I've already built something that applies, the NFC asset management system, the hot work permit platform, the sensor monitoring work for example, those link directly to the case studies. The idea is to show that vision without proof is just prediction, and proof without vision is just a feature demo.
The honest bet: this is better content coming from someone who's spent six years on jobsites than from someone who's read about them.
A single piece can demonstrate strategic technology vision without losing field credibility
The risk is that a "future of construction" piece reads as speculative and disconnected from reality. The hypothesis is that grounding each floor in real construction phases, with links to proven implementations, prevents that.
Connecting speculative concepts to proven implementations strengthens credibility for both
Linking "here's what sensors could do on a jobsite" directly to "here's a sensor monitoring system I actually built" should validate the vision rather than undercut it.
People engage with the full experience, not just the first floor
If scroll depth drops off sharply after floor 2-3, the content depth per floor needs work, either too dense, too light, or the navigation isn't clear enough.
2026 Shipped
The three child pages (Knowledge Graph, PPE Anatomy, AI Risk Matrix) were previously invisible from the parent construction site page — no navigation surfaced them. Added a pill-style horizontal nav bar between the hero and the iframe. Clicking a pill swaps the iframe src and updates the active state. Also removed plan.md from the repo now that the planning phase is done.
2026 Bug
The knowledge graph was silently dying on load — ~20 places used comma operators instead of subtraction in arithmetic expressions (node placement, physics sim, coordinate transforms, hit detection, event offsets), causing SyntaxErrors that killed the entire script on all devices. Fixed all the operators, corrected a `createRadialGradient` call with 9 args instead of 6, added `e.preventDefault()` on touch panning to stop page scroll interfering with graph pan, and added `100dvh` fallback alongside `100vh` to fix iOS Safari viewport collapse.
2026 Shipped
The Shift+Alt+D dev overlay tool had basic drag and resize. Rebuilt it with 4-corner handles that write clip-path coordinates directly so overlays can be perspective-matched without guessing pixel values. Added keyboard-controlled skew, image pan and zoom inside the frame, and a south-edge handle for height that seeds from the current rendered size rather than zero. Makes it practical to dial in any monitor or screen overlay to the correct perspective angle entirely inside the browser.
2026 Shipped
Used the upgraded overlay editor to visually dial in and lock final pixel coordinates for all three interactive zone overlays: the phone button on the Worker floor, the TV screen in the Safety wall zone, and the right monitor at the Superintendent desk. Each position was verified against the source photography and hard-coded into the HTML. The overlays now land correctly on first load and persist across sessions without needing the edit tool open.
2026 Bug
Three bugs resolved: icon card popups weren't firing due to a script registration issue after the rename, deep-link floor routing (arriving at `#floor-3` etc.) wasn't activating the correct floor on load, and the rename from `construction-mockup` to `construction-site-of-the-future` broke relative chat script paths. Fixed the popup trigger registration, added an `onhashchange`-aware floor initializer, and added fallback absolute paths for the chat scripts.
2026 Shipped
Interactive SVG risk matrix plotting 8 construction roles against 4 cross-industry comparisons (cashier, software engineer, lawyer, radiologist) on impact vs. timeline axes. Each role has a clickable detail panel: what's changing, what's protected, where the trajectory goes. Parked at /lab/construction-site/ai-risk-matrix/ as its own lab card (LAB-006) for iteration before integrating into the Construction Site of the Future page.
2026 Shipped
Added a high-res PNG dashboard preview to the superintendent's desk monitor in the integration hub scene, clipped to match the trapezoid perspective of the monitor face. Took two passes: first pushed a blank webp by mistake, reverted, then replaced with a proper PNG screenshot. The monitor actually shows something now instead of an empty frame.
2026 Shipped
The sensor markers across floors 1 and 3-8 were landing in wrong positions due to isometric perspective, an open bug since Feb 25. Manually derived and applied correct coordinates for all 25 sensors. Replaced the old SVG pulse circles (wrong positions, never looked right) with a CSS ::before/::after pulse animation on sensor-node-trigger elements so every clickable zone shows a visible orange pulsing dot at all times. Closes the open sensor alignment bug.
2026 Shipped
Added two dev tools behind keyboard shortcuts so they don't surface to visitors. Shift+Alt+D opens a drag-and-resize overlay tool for both monitor overlays with live coordinate readout and a copy button, removing the need to guess pixel values in code. Shift+Alt+E reveals the sensor edit button. Both invisible by default.
2026 Shipped
Replaced the existing portfolio homepage with a new dark-mode design, updated copy, wired CTAs, social links, and a dedicated CSTF strip. Added three case study pages grounded in real project data, one with $240K+ in documented savings. On the lab hub, the CSTF card went from placeholder to live: swapped the SVG floor plan mockup for a scaled iframe of the actual experience, updated the CTA to /lab/construction-site/, and ran a full mobile responsiveness pass on all homepage sections afterward.
2026 Shipped
The worker figure on the floor plan was opening the standalone worker-mobile.html, no role context, wrong landing state. Changed the hotspot handler to load the role dashboard with URL params that lock role to "worker" and set context to worker_phone_focus. The embedded view is scoped from the start: no role picker, correct phone UI, no ambiguity. Bumped the experience version string to flush the iframe cache for all visitors.
2026 Shipped
The phone preview inside the role dashboard was a single static layout. Built a tabbed multi-view so the preview switches between app states, home, task detail, video detail, using a tab bar that mirrors how the actual app would work. Also refined the phone layout from a generic dashboard to a video detail screen and dropped the floating headshot avatar that was adding visual clutter. Took two passes: first to get the tab structure in, then to wire each tab to the correct view.
2026 Shipped
Built /ppe/research.html: a full sourced article covering all 27 PPE technologies with inline verdict badges (Verified / Misleading / Inaccurate) and clickable citations. The point is to back up the PPE guide cards with actual research, not just confident-sounding copy. Added a "Research & Sources" ghost link in the PPE guide header. Content went through a revert-and-redo cycle to reconcile the article with the corrected card data, needed to get the data right first, then build the article on top.
2026 Shipped
Clicking "Open Worker Phone App" was navigating away or opening a new tab, both break tour context. Rebuilt it as a full-screen modal overlay with an iframe inside, using the History API to push a state entry so the browser back button naturally closes it. Added an orange "Exit App" button in the modal header as a second close path, and kept an "Open in new tab" escape hatch for power users. Keeps context without trapping anyone.
2026 Shipped
Started the day cleaning up the PPE anatomy tool. Mobile layout now shows the full worker figure with the panel stacked below instead of side-by-side. The mannequin silhouette had a viewport clipping issue, fixed the container bounds so it renders fully. Ran a fact-check correction pass: reclassified Impact Sensor Eyewear (no commercial products exist, moved to emerging) and Helmet Hearing Hub (moved to standard), raised cost floors on 8+ technologies to match real product pricing, and corrected vendor attributions for Grip Augmentation, Airbag Integration, AR Contacts, and Face Shields. The data needed to be right before building the research page on top of it.
2026 Shipped
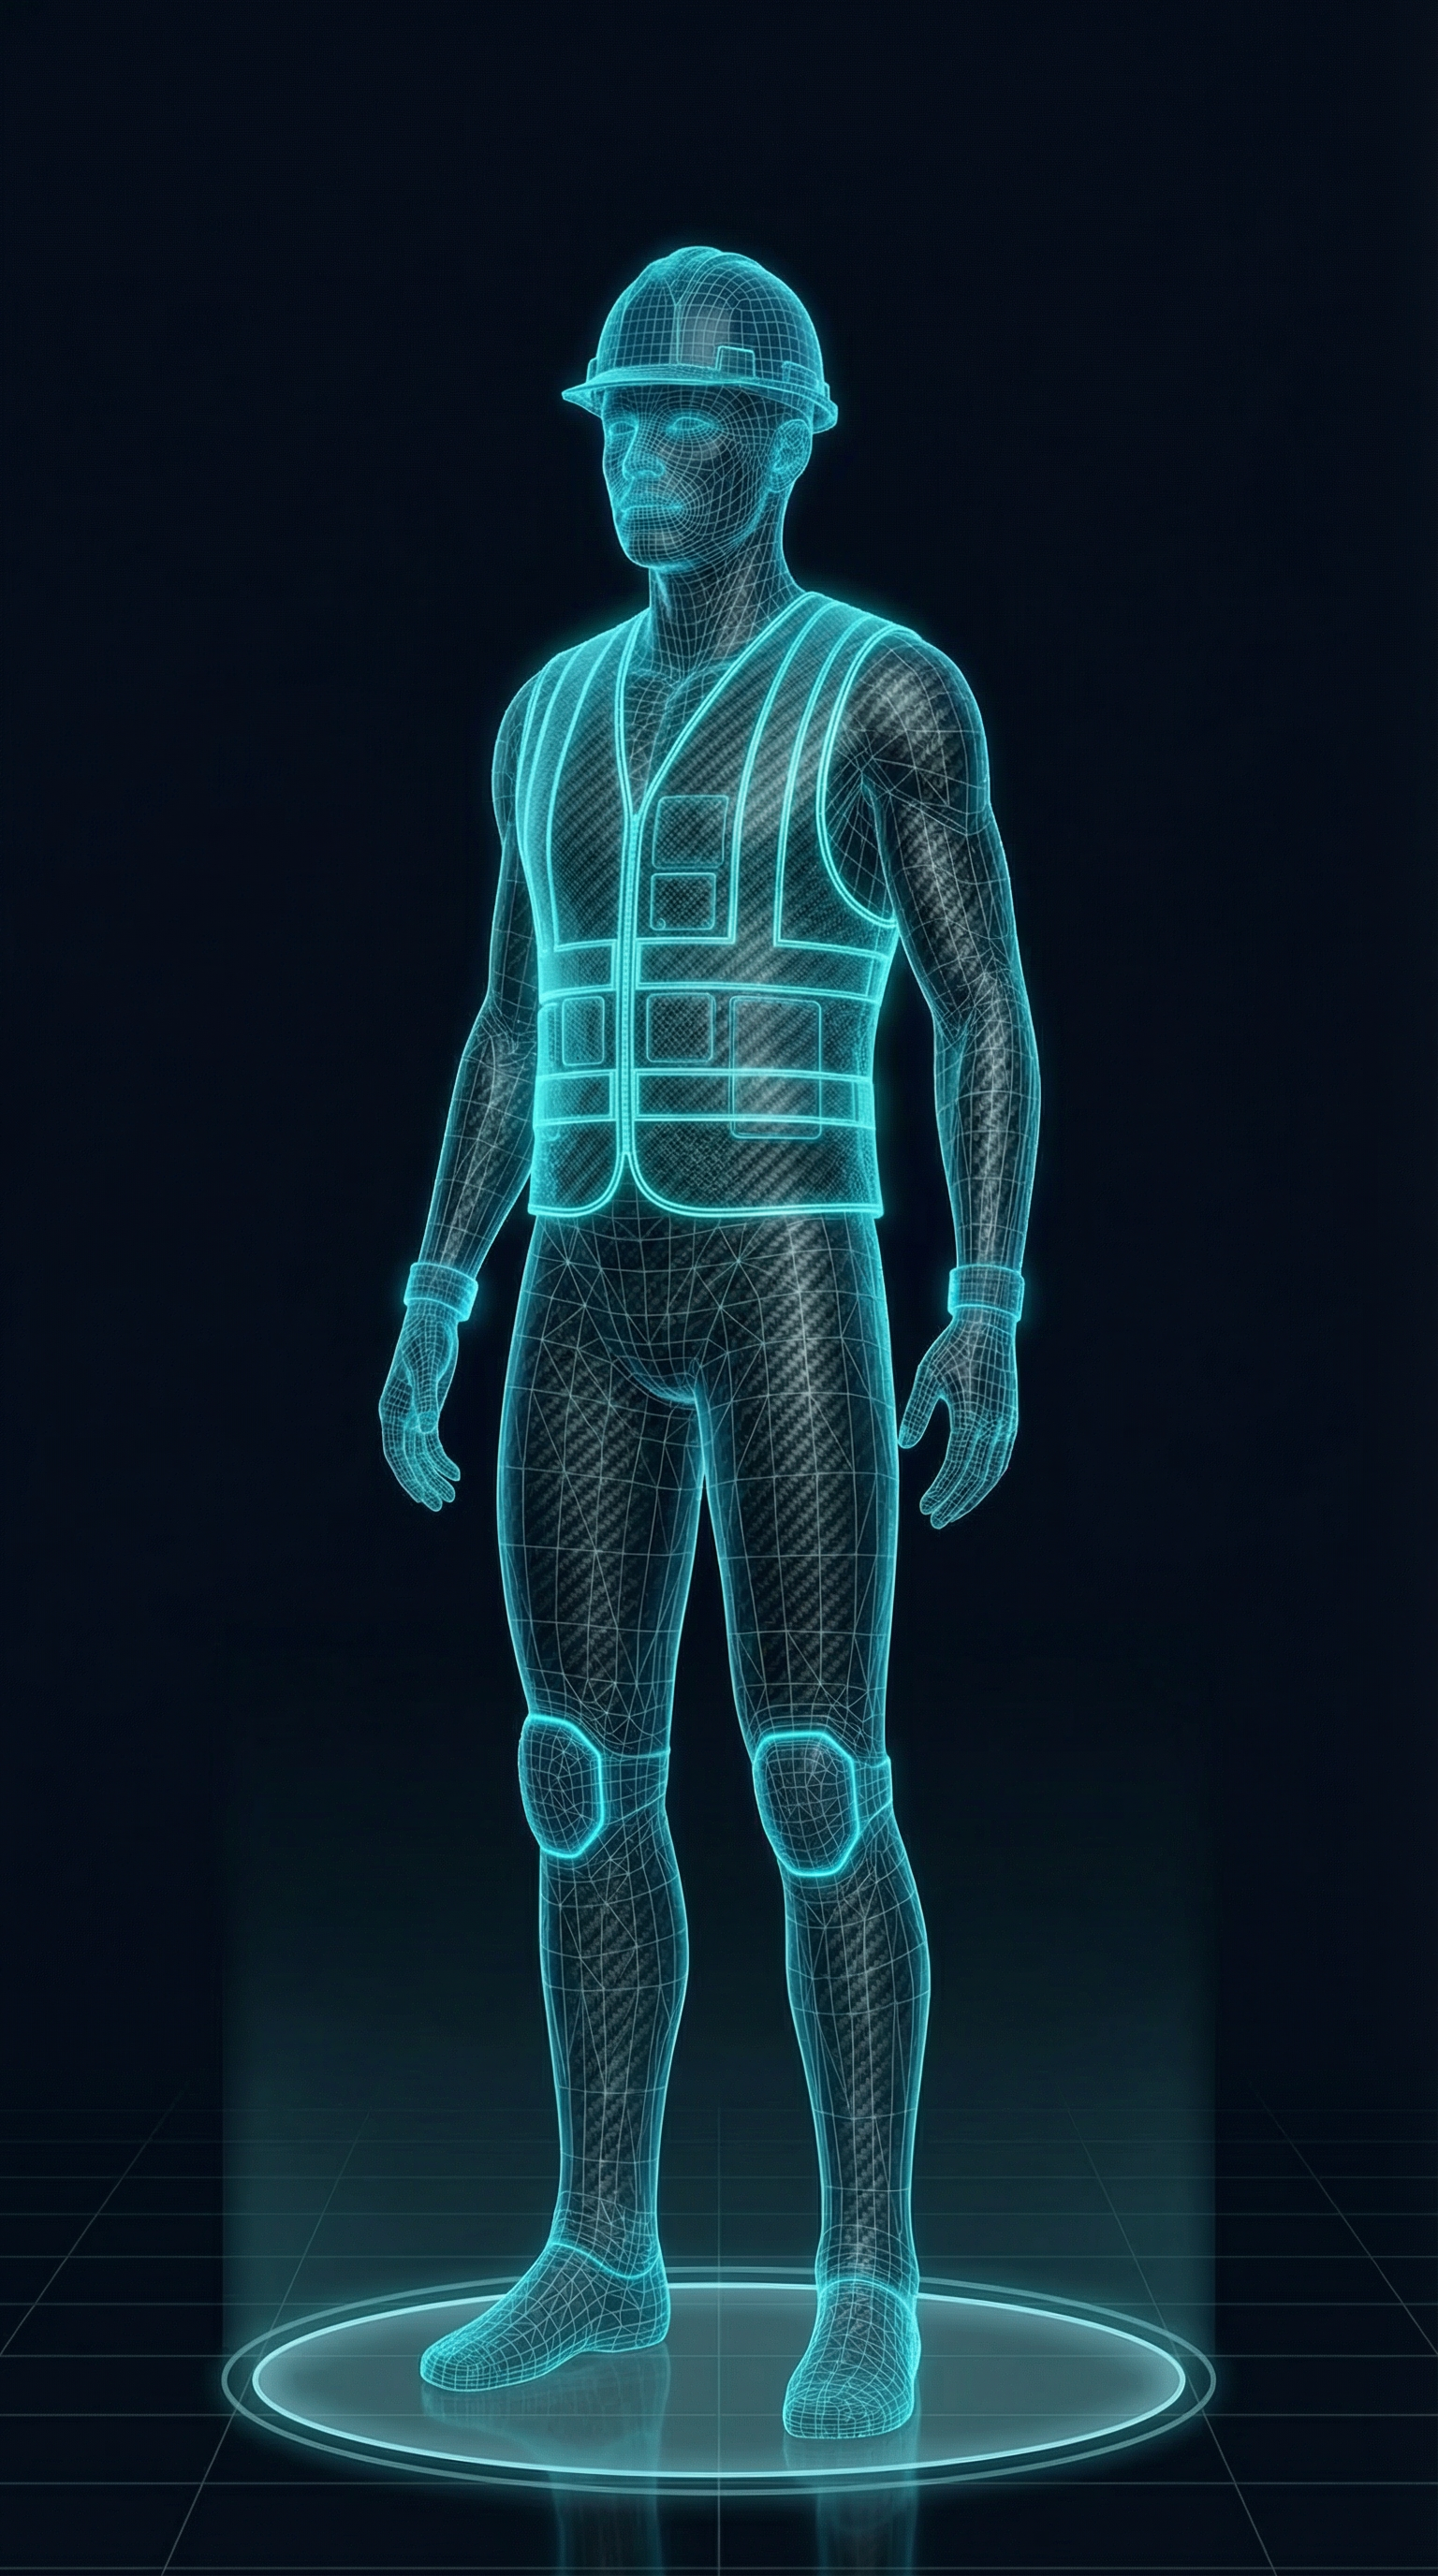
Built an interactive experience around a holographic construction worker silhouette, click any body zone to surface what gear is assigned, toggle between Standard and Next-Gen to compare current kit against the future spec, or browse the full 58-item technology library. Purple accent overlays distinguish next-gen items at a glance so the comparison is immediate. Took several passes to get right: body-part label was rendering blank when a zone had no items (fixed), sensor tech data needed a fallback popup when unavailable (fixed), and the layout needed a full responsive pass for mobile. The holographic glow and gear icon on the worker's chest give the module its visual identity.
2026 Shipped
The full-width embedded chat section was interrupting the floor-scroll flow on the construction site page, heavy, wrong context for someone moving through the building. Replaced it with a slim strip: avatar, a short framing line, and an "Ask Nick" button. The full chat now opens as a floating panel anchored bottom-right, with a backdrop overlay, close button, and escape key support. Mobile-responsive.
2026 Shipped
Added three role-specific data dashboards, worker, foreman, and exec, embedded directly into the trailer's POV screens. Each seat in the construction command center now has context behind it: the worker sees their task and safety feed, the foreman gets site operations, the exec gets project-level metrics with a weekly reporting template. Added a worker mobile app mockup showing the full incident response flow, aligned to the actual alert playbook logic rather than being decorative. The trailer experience now tells different stories depending on which screen you focus on.
2026 Bug
The interactive technology knowledge graph was fully built but unreachable, the trailer door navigation was swallowing the click before the graph loaded. Traced it to a z-index and pointer-events cascade in the trailer overlay layer intercepting the trigger. Fixed the rendering order and wired the click through correctly. Also corrected the back link inside the knowledge graph, which was routing to a dead end; it now returns to the trailer interior as expected.
2026 Shipped
Each sensor info popup now includes a small thumbnail of the floor it belongs to, with an orange dot marking exactly where that sensor sits. Added a FLOOR_IMAGES lookup table and minimap dot positioning logic to showSensorPopup(). Also fixed a mobile bug where the popup was being cut off at the bottom, the scroll container now always resets to the top on open, and there's enough bottom padding for the close button to not feel cramped.
2026 Bug
metal-framing-v2.png has a valid PNG header and correct file size (6.18MB) but the IDAT chunk is broken, zlib throws "invalid stored block lengths" on decompression. The browser sees a valid signature, renders the .floor-visual { background: white } behind it, and the SVG overlays sit on top normally, so symptoms look like a white box with sensor dots floating in it. The fallback metal-framing-floor.png has the same corruption. Fix is a clean re-upload of the floor 7 photo.
2026 Bug
The interactive tech knowledge graph shipped and is fully built, but getting to it is blocked by a bug in the trailer door entry point on the construction site page. Still diagnosing, the z-index and pointer-events fixes from the previous pass didn't fully resolve it. Something in the click flow or navigation handler is swallowing the trigger before the graph loads. Open.
2026 Shipped
Changed all sensor dot and pulse ring colors from blue (#00A3FF) to orange (#f97316) to match the page's primary accent color, the blue wasn't wrong, it just didn't feel intentional next to the orange type. Replaced the SVG SMIL pulse animations with a CSS keyframe that scales the ring to 2.4x and fades out, so the effect is consistent across every floor without touching individual elements. Removed the debug coordinate grid that had been left in since the sensor positioning pass. Pushed everything live.
2026 Shipped
The sensor dots were clickable but the tech tags at the bottom of each floor were static labels. Added onclick handlers to all of them so clicking a tag surfaces the same callout overlay as clicking the dot directly. Floors 8, 7, and 6 already had this wired from a previous pass, added it to floors 5, 4, 3, and 1. Also caught that floor 6 had an HVAC callout with no corresponding tag at all; added it. Every sensor on every floor now has two entry points: the dot on the illustration and the label in the footer.
2026 Shipped
Worked through the four remaining unpositioned floors using the coordinate grid tool. A few patterns that emerged: some sensors make more sense as two dots connected to one callout (moisture monitoring on floor 5, IAQ on floor 4) rather than separate callouts, a dashed secondary line communicates "same system, different location" better than duplicating the card. Added sensors that were missing entirely: leak detection on floor 3, ergonomic/battery tools on floor 4. Floor 1 (foundation) also got a full pass, autonomous earthmovers, drone dock, AI security, and workforce tracking all repositioned onto the actual scene geometry.
2026 Shipped
Added a coordinate debug grid (1000x560 viewBox, 100-unit intervals, pink toggle button) to aid precise sensor placement on isometric floor illustrations. Worked floor-by-floor: repositioned crane load, wind speed, and fall detection sensors on floor 8; added laser measuring tools sensor and tech tag on floor 7; repositioned NFC fire extinguisher tracking, AR BIM view, and smart HVAC on floor 6. Added a second NFC fire extinguisher sensor and implemented triggerRevealMultiple() to show both callouts simultaneously from a single button. Also resolved deployment pipeline, changes need to be pushed to Nickrogoff.com/construction-site-of-the-future/index-v3.html, not the standalone mockup repo, for Cloudflare to pick them up.
2026 Shipped
construction-site-future.html moved to lab/construction-site/index.html. Fixed all remaining relative nav links (index.html#about, #journey, #projects, #contact) to absolute root-relative paths; from a subdirectory they were resolving against lab/construction-site/ instead of the portfolio root. Added CLAUDE.md documenting the iframe/wrapper architecture split, the fixed-height iframe constraint, the scroll indicator container height issue, the isometric coordinate system for SVG overlays, and the full build log. Shipped a /lab-log skill for session capture.
2026 Shipped
Added SVG overlays to the floor illustrations to visually identify and distinguish sensor types, without labels, the sensor markers were interchangeable and the scenes weren't communicating the technology load. The overlays are rendering, but sensor positions didn't map cleanly onto the isometric illustrations on first pass. The coordinate system doesn't account for perspective distortion, so markers are landing in the wrong places on several floors. Working through a fix using an overlaid reference grid per image to derive accurate coordinates before locking positions. Longer term: each sensor marker should open an inline card explaining what the sensor measures and why it matters on a real jobsite, so the experience is educational, not just decorative.
2026 Shipped
Three separate scroll issues resolved in one pass. The floor indicator dot was stuck at the top of the elevation drawing because its parent container had zero computed height, all children were absolutely positioned, so nothing gave the div real dimensions and every percentage top value resolved to zero. Fixed by moving the building elevation image inside the container so it provides actual height. The iframe was also causing the scroll listener to never fire: it was growing to match its content, so the parent page was scrolling, not the iframe. Changing it to a fixed 100vh height means the experience scrolls internally and the JavaScript scroll events work as expected. On top of that: auto-hiding nav (slides up after 80px of scroll, returns on scroll-up) so the building scene isn't blocked by the header. And an animated orange connector line that grows downward from the base of the elevation drawing to the site plan when you reach the foundation floor, so the visual descent reads as continuous.
2026 Shipped
The floor images were loading but the SVG overlay system, callout boxes, dashed connecting lines, sensor labels, was baked on top of them in code rather than in the images themselves. On first inspection this looked like an image loading failure; it was actually the overlays obscuring and competing with the illustrated scenes. Stripped all SVG callout overlays from floors 6, 7, and 8 so the illustrations render cleanly. Also switched floor 8 to the wider-angle steel erection illustration that captures the full site context instead of just the close-up welding shot. The plan is to add sensor callouts back through purpose-built SVG animations, this gives proper control over what appears, when, and with what data, rather than static overlay boxes that don't compose well with the images.
2026 Shipped
Sorted out the GitHub repo configuration that was blocking the site from building and deploying correctly. The Construction Site of the Future is now live and accessible from the portfolio. This is a preliminary deploy, the structure and navigation are working, but two things surfaced immediately on first real review: the floor illustrations and the overall design system both need work before this can be considered production-ready.
2026 Bug
The images intended for the floor scenes, generated specifically for each construction phase, are not loading as expected on the live site. The SVG layout structure is present, but the correct image assets aren't resolving in the deployed context. Likely a path or asset reference issue introduced during the repo configuration fix. Need to audit all image references against the deployed file structure and confirm the right generated images are in place for each floor.
2026 Finding
First real look at the deployed site made it clear the visual design doesn't have a coherent direction yet. Typography, color, spacing, and the relationship between the floor illustrations and the surrounding UI all feel provisional. The content concept is solid but the presentation isn't pulling its weight. Need to define a design direction before continuing content iteration, otherwise each pass will create more to undo later.
2026 Shipped
Full structural build complete: vertical scroll layout with floor navigation, scroll-triggered animations, 7 illustrated scenes (SVG layout with Gemini-generated images for better rendering quality, SVG icon overlays for consistency), and an integration hub dashboard mockup. Pushed to GitHub for version control. Three things to iterate on next: illustration quality consistency across floors, mobile responsiveness of the scroll experience, and content depth, some floors are more developed than others and that unevenness shows.
Cold outreach has a fundamental problem: the person you're reaching out to has no context before they decide whether to reply. You're asking them to make a bet on a stranger based on a short message and a LinkedIn profile.
The hypothesis is that a well-trained AI persona can change that calculus. Instead of reading about Nick, a recruiter or founder can just ask him something, and get a real answer in his voice, right now, at 11pm, without a calendar invite. The AI does the first meeting's work before the first meeting happens.
This is also a genuine product challenge: building a persona that's accurate but not creepy, specific but not scripted, and helpful without hallucinating credentials that don't exist.
An AI persona increases meaningful inbound contact compared to static portfolio pages alone
A static portfolio is a brochure. A chat interface is a conversation. People who talk to an AI version of you are more likely to reach out directly because they already feel like they know you.
System prompt quality matters more than model size for persona accuracy
A detailed, well-structured system prompt with real voice patterns, specific metrics, and documented projects should outperform a vague prompt on a bigger model. The signal is in the context, not the compute.
Prompt chips significantly increase first message rate
The hardest part of a chat interface is the blank box. Pre-seeded chips remove the activation energy and suggest what kinds of questions are worth asking, which doubles as content strategy.
2026 Shipped
ai-chat.html moved to lab/ai-chat/index.html, nick-chat-widget.html moved to lab/ai-chat/widget.html. Fixed the relative index.html#contact link in the chat limit message; from the subdirectory it was resolving to lab/ai-chat/index.html#contact instead of the portfolio contact section. nick-chat-prompt.js and nick-chat-floating.js stay at root since they're loaded across the full portfolio. Added CLAUDE.md flagging the system prompt as single source of truth, the three files where the Worker proxy URL lives, and the stale deployment notice that needs removing. Shipped /lab-log for session capture going forward.
2026 Shipped
Isolated the root cause of the API failure: the chat interface was pointing at the wrong Worker URL in production, so requests were never reaching the proxy. Corrected the endpoint, redeployed, and confirmed end-to-end message flow live, from the browser, through the Cloudflare Worker, to the Anthropic API, and back. Chat is now functional on the dedicated page and across the floating widget. One bug remains open: the sizing inconsistency on smaller and wider viewports.
2026 Shipped
Deployed a Cloudflare Worker as a serverless proxy to handle all API communication with the LLM, keeping the API key server-side and enforcing rate limiting at the edge. The chat interface is now embedded and functional across the entire portfolio, not just the dedicated ai-chat.html page. The Worker approach keeps cost control and abuse protection server-side without requiring backend infrastructure spend. Two bugs surfaced on first cross-device pass.
2026 Bug
The floating chat panel and embedded interface have inconsistent sizing behavior across screen sizes. It clips content on smaller phones and doesn't constrain properly on wider desktop displays. Investigating responsive CSS breakpoints and whether the issue is in the widget's own sizing logic or parent page context.
2026 Bug
Chat interface loads but responses aren't returning. The Worker is deployed but the API connection is failing on the live site. Suspected cause: environment variable binding in the Cloudflare Worker or CORS headers on the response. Need to pull Worker logs to isolate.
2026 Finding
Incorporating the chat widget across all portfolio pages surfaced styling inconsistencies. The chat's dark theme and typography don't fully harmonize with the lighter styles on the main portfolio and case study pages. A design pass is needed to unify color tokens, spacing, and widget presentation across contexts before this can be considered complete.
2026 Shipped
Complete front-end implementation: dark-themed chat interface with Barlow/DM Mono typography, animated typing indicator, auto-resizing textarea, prompt chips for guided first messages, and a detailed system prompt encoding Nick's voice patterns, project metrics, and career philosophy. The UI is fully functional, the only remaining step is wiring up a backend proxy (Cloudflare Worker or Vercel Edge Function) to keep the API key server-side. Intentionally transparent about this status via the in-page deployment notice. Next milestone: proxy deployment and live API connection.
Workplace fatal injury data is publicly available but almost nobody looks at it. BLS publishes tables. Researchers write papers. But the geographic story of where workers die at higher rates, and in which industries, never gets told in a way that makes the pattern immediately visible.
The terrain metaphor is intentional: states where risk peaks should feel like peaks. You should be able to see the landscape at a glance and know where workers have it harder. The animation over time adds the question of whether risk is converging or diverging across states and industries.
This is also a technical test. WebGL terrain rendering, BLS data parsing, and an interactive label system are all things I wanted to know if I could build from scratch before using them in anything more formal.
2026 Bug
A redundant popup was firing on mobile — the tap handler was registered twice, causing the info panel to open and immediately re-trigger. One-line fix to deduplicate the event listener registration.
2026 Bug
The info panel on desktop was using absolute positioning inside a relatively-positioned container, which let it float over the terrain visualization at certain viewport heights and clip the map. Switched to a flex column layout with `margin-top: auto` so the panel always pins to the bottom of the container. The terrain now has full unobstructed vertical space above it.
2026 Bug
The mobile loader was silently failing when WebGL was unavailable—the fallback callback was registered but never firing because the context check ran before the event listener was attached. Fixed the initialization order. Also found the mobile tip markup had been stripped in a previous pass; restored the tooltip guidance so mobile visitors get the swipe/tap hint on first load.
2026 Shipped
The 3D visualization had no mobile story. Added a static fallback for browsers where WebGL is unavailable, then built a proper mobile layout: the UI reduces to just the map and a single play control, viewport framing and timeline controls are sized for small screens, and the info cards use tap-to-open / tap-to-close instead of hover. Separately, a greedy overlap-resolution pass now sorts labels by active state and rate value, nudging each one vertically until it clears the labels below it. Label backgrounds are darker, box shadows add depth separation from the terrain, and the default opacity went from 0.38 to 0.88 so labels are readable without hovering.
2026 Shipped
The original visualization used a white bottom panel that broke against the dark 3D canvas. Rewrote the UI layer to use the lab design system: dark background, IBM Plex Mono and Sans, orange accent for rates and timeline controls. Fixed an invisible title bug where the title was rendering white-on-white. All text sizes increased for legibility.
2026 Shipped
Initial build complete. WebGL terrain renders fatal injury rate data from BLS/CFOI as a 3D landscape, animated over time. State peaks correspond to injury rate; the color gradient runs from low (blue) to high (red). Interactive labels show state name, rate, and ranking on hover. Timeline controls let you step through years or watch the animation play.
The PPE conversation is usually either too generic ("wear your PPE") or too speculative ("the future is coming"). This module bridges both by mapping gear directly to body zones and letting someone switch between today's standard kit and next-gen concepts instantly.
The overlay interaction makes the model practical: click a zone, inspect what's assigned, compare against future gear, and quickly understand where innovation is real versus hype. It works as a visual explainer and a concrete design artifact for safety-tech discussions.
This lab is marked shipped. The original hypothesis, that an interactive body overlay would communicate PPE decisions better than static slides, has been validated enough to keep as a finished portfolio artifact.
2026 Bug
The exit button, research link, and standard/next-gen toggle were all absolutely positioned and overlapping at mid-width desktop viewports. Replaced with a three-column flex controls bar (exit left, toggle center, spacer right) so they never collide. Removed the old 96px top-padding hack that existed only to clear the overlapping header block. Also recalculated `.worker-container` height to give the figure ~110px more head-to-toe room. Added a mutual link between `/ppe/` and `/lab/construction-site/ppe-anatomy/` so the two PPE views are navigable from each other.
2026 Shipped
Core experience delivered: clickable body zones, standard vs next-gen toggle, and full PPE technology library for side-by-side comparison.
2026 Shipped
Added the citation-backed research page with verdicts and source links to make the PPE model auditable and not just conceptual.
2026 Shipped
Aligned badge styling, tuned CTA treatment, and finalized shipped presentation details for the PPE lab and research flow.
The AI displacement conversation in construction is almost always wrong. People either dismiss it entirely ("construction can't be automated, it's physical") or apply generic knowledge-worker risk models that don't account for the industry's fundamental data infrastructure gap.
The truth is more specific: construction roles cluster later and lower on any AI exposure matrix than comparable office roles, not because AI doesn't apply, but because you can't automate workflows that aren't yet digital. The BIM coordinator has more AI exposure today than the field laborer for exactly that reason.
This matrix is an attempt to put construction's AI timeline in honest context, using published research from Anthropic's Economic Index, Goldman Sachs, BLS O*NET, WEF, and McKinsey, with non-construction comparisons (cashier, software engineer, lawyer, radiologist) to calibrate what "high risk" actually looks like. Click any role to get the specific mechanism of change, what's protected, and where the trajectory goes.
Cross-industry comparison changes how builders read their own position
Showing a field laborer next to a retail cashier on the same matrix shifts the frame. The hypothesis is that comparison, not just absolute placement, is what makes displacement timelines legible.
The "data infrastructure gap" framing resonates with construction technology leaders
The argument that construction roles are protected by missing data infrastructure, not by physical complexity alone, is a more precise and useful framing than the generic "AI can't do physical work" claim.
Role-specific detail panels drive more engagement than the matrix itself
The matrix is the hook; the panels are the value. If most users only look at the matrix and don't click roles, the content model needs work.
2026 Shipped
The vertical role list at ≤640px was functional but flat. Replaced it with a horizontal bar chart showing all 12 roles ranked by AI task exposure percentage. Staggered CSS animations fill each bar on load with a spring curve. Stat block at the top shows construction avg (24%) vs. other industries (48%) with orange/purple glow numbers. Color tracks the same construction/comparison split as the desktop scatter plot. Tap behavior unchanged — all bars still open the full detail panel.
2026 Bug
The SVG scatter plot was overlapping adjacent elements at mobile widths and scaling too small to be readable. Rather than forcing a cramped plot onto a 390px screen, replaced it at ≤640px with a sorted vertical list of all roles ordered by displacement risk score. Each row shows the role name, risk tier, and timeline estimate. The comparison toggle still works in list mode and highlights comparison rows inline.
2026 Bug
The "Show comparisons" toggle for cross-industry bubbles (cashier, software engineer, lawyer, radiologist) had inverted boolean logic — clicking "show" hid them and vice versa. Fixed the state variable initialization. Toggle label now matches the actual visibility state on first load and subsequent clicks.
2026 Shipped
Initial build of the interactive SVG risk matrix. 8 construction roles (orange) and 4 cross-industry comparisons (purple) plotted on impact vs. timeline axes. Each role opens a three-section detail panel: what's changing, what's protected, where the trajectory goes, plus a bottom-line summary. Sourced from Anthropic Economic Index, Goldman Sachs, BLS O*NET, WEF Future of Jobs 2025, and McKinsey construction research. Parked at /lab/construction-site/ai-risk-matrix/ for iteration before integrating with the Construction Site of the Future page.
Every construction safety software evaluation I've seen follows the same pattern: a vendor sends a deck, somebody watches a demo, a decision gets made mostly on who had the best sales rep. The actual criteria — does it work on a phone in a tunnel, does it talk to Procore, how hard is it to roll out to 50 subs — get surface-level answers at best.
There are 23+ platforms in this space, ranging from plug-and-play field apps to IT-department-level deployments. Most don't publish pricing. Most don't publish real implementation timelines. The data that does exist is scattered across G2, Capterra, vendor sites, and sales decks, none of which have an incentive to be honest about limitations.
This tool is a practitioner-to-practitioner attempt to change that. I researched and normalized 23 platforms against a consistent schema — complexity scores, Procore integration status, AI capability level, cost tier — and built a filter tool designed for a safety director doing a real evaluation, not a marketing audience. Data quality flags surface explicitly. Estimated fields are marked. The notes are written to be useful, not promotional.
Built as a Safety Net Dispatch content asset. Architecture is designed to add a second dataset (prequalification software) in a future version.
Practitioners will engage more with honest data than polished content
Surfacing estimated fields and data quality flags explicitly will increase trust and time-on-tool rather than reduce it. Safety directors are used to vendor noise — transparency is a differentiator.
Procore integration is the most-used filter
Most mid-size GCs are already on Procore. "Does it connect?" is the first question, not the last. The toggle for Procore-only will see disproportionate use.
This becomes a starting point for a SND vendor guide, not just a standalone tool
The practitioner notes format and data schema are reusable. If this gets traction, it should evolve into a maintained resource — updated quarterly, expanded to prequal software, cross-linked to deeper vendor writeups.
2026 Shipped
Color-only redesign to align the tool with Safety Net Dispatch's editorial design language. Dark navy (#0f172a) → warm cream (#f2ede8), cards → white, sidebar → slightly darker cream, section labels → SND orange. Active tabs and view-toggle flipped to orange. All badges converted from light-on-dark to dark-on-light tints. Scatter plot axes, grid, and labels updated for the light background; bubble logo circles switched from dark navy to white for favicon contrast. No content or layout changes.
2026 Shipped
Added a `pricing_detail` field to each platform in dataset_main.json with three sub-fields: `publicly_available` (yes/partial/no), a plain-language summary of actual tiers or cost estimates, and a source note. The platform detail modal now renders this as a separate pricing section with color-coded availability badges (green/yellow/gray) and formatted summary text. Makes it easier to filter by cost without relying solely on the broad cost-tier bucket.
2026 Shipped
Bubble chart: X-axis implementation complexity, Y-axis company size fit, bubble size = module count, default color = primary user. Company favicons display inside each bubble (letter fallback). Hover shows a tooltip preview; click opens the full detail modal. Five toggleable color overlay pills let you recolor by cost tier, mobile vs. desktop, Procore integration, AI capability, or use case focus — clicking the active pill resets to default. The scatter plot respects all sidebar filters and redraws on any filter change, keeping cards and matrix in sync.
2026 Shipped
Two new datasets: Contractor Prequal (ISNetworld, Avetta, Veriforce, Highwire, Billy — 5 platforms) and Enterprise & Specialty (Intelex, Urbint, Oracle CIC, Intenseye — 4 platforms). A tab switcher above the toolbar fetches the selected dataset, resets all filters, and re-derives filter options from the new data — no hardcoded filter values. New label maps handle prequal-specific categories (prequalification, COI documentation, AI risk analytics, computer vision safety). The main Jobsite Safety dataset stays at 23 platforms.
2026 Shipped
Single-file HTML tool loading dataset_main.json externally. Filters: company size, cost tier, max implementation complexity (slider), platform orientation, Procore-only toggle, AI capability, use case focus, category. Card grid with complexity dot indicators, color-coded badges, first-sentence summaries. Table view toggle. Platform detail modal with full practitioner notes, modules, use case tags, data quality flags, and estimated-field markers (*). Schema designed to add a second dataset (prequalification) in V2 without UI code changes. Built as a Safety Net Dispatch content asset, hosted under nickrogoff.com/lab for now.
Every safety manager I know produces some version of the same artifact every month: incident counts, TRIR, toolbox talk completion, PPE audit results, pasted into a PowerPoint or an Excel grid and emailed to leadership. The data already lives in a spreadsheet. The presentation layer is where it goes to die.
This experiment asks how small that gap can get. It's a single HTML file that reads a public Google Sheet through the Google Visualization API — no backend, no login, no vendor subscription. The safety manager updates one row a month in a sheet they already own, and the report card updates itself. Month-over-month navigation, conditional green/yellow/red status logic on every KPI, and a big odometer-style "Days Since Last Lost-Time Incident" counter as the centerpiece, because that's the number crews actually track.
If the fetch fails or no sheet is connected, it falls back to a realistic sample dataset and keeps working — the demo is never broken. Built as a Safety Net Dispatch field tool, framed generically so any construction safety team can copy it.
A Google Sheet is enough backend for monthly KPI reporting at small and mid-size GCs
The reporting cadence is monthly and the data volume is one row per month. EHS platforms charge real money for this layer. A sheet the safety manager already owns, plus a static HTML file, should cover the whole job for teams without enterprise tooling.
Making Days Since Last LTA the centerpiece changes what the monthly meeting talks about
Most report decks bury the streak metric under TRIR tables. Rendering it as a large odometer reframes the report around the number field crews already track on the site sign, and should pull the conversation toward leading indicators.
Safety managers will adopt a tool they can copy and own over a vendor dashboard they rent
The whole tool is one file plus one sheet. No procurement, no IT ticket, no per-seat pricing. If the zero-infrastructure pitch lands, copies and template-sheet duplications should outpace pageviews of comparable vendor content.
2026 Shipped
New panel next to the targets button: paste a Google Sheet link, the dashboard reads it directly in the browser via the same gviz endpoint — no account, no server, nothing uploaded. Three-step setup with a copy-headers button (tab-separated, pastes straight across row 1). The connection persists in localStorage and lands in the page URL as ?sheet=…, so a connected report card is shareable with a plain link. Resolution order: shared link → saved sheet → built-in sheet ID → sample data. Failed connections keep whatever data was showing and explain the usual fix (publish to web + anyone-with-link viewer). This quietly changes the distribution story: the tool no longer needs to be copied and edited to be used.
2026 Shipped
Flipped from the dark developer aesthetic to SND's warm cream design language, same move LAB-007 made: cream #f2ede8 page, white cards, orange gradient hero with a serif heading, Barlow body + DM Mono data values. All safety acronyms replaced with plain language a stakeholder can read cold — TRIR → Recordable Incident Rate, LTA → Lost-Time Incident, Open CAs → Open Corrective Actions, PPE → Protective Equipment. Added a Performance Targets panel: every green/yellow/red threshold is now user-editable (recordable rate bounds, toolbox talk percent-of-goal, corrective action targets, streak day bands, and the rest), applies live to both the report card statuses and the chart bands/reference lines, persists per browser with a reset to defaults. Sheet schema unchanged.
2026 Shipped
Added a Report Card / Trends toggle. Trends renders hand-rolled inline SVG charts — still zero dependencies — with the chart type matched to each metric: sawtooth area with threshold bands for the LTA streak (resets are the story), line over green/yellow/red bands for TRIR, zoomed line with dashed 90%/95% target lines for PPE compliance, status-colored bars for incidents and open CAs (with a ≤3 target line), lollipops with a ≥10 target line for near misses so 'good high' reads differently than 'bad high' bars, bullet bars with goal ticks for toolbox talks, and a neutral stepped line for active sites. Selected month is highlighted across every chart and stays in sync with the month selector; native SVG title tooltips on every point.
2026 Shipped
Single self-contained HTML file. Fetches the sheet via the gviz /tq endpoint, strips the setResponse() wrapper, and handles both gviz header modes (column labels vs. first-row headers). Eight KPIs with conditional green/yellow/red status logic: incidents, TRIR, near misses, toolbox talks vs. goal, PPE compliance, days since last LTA, active sites, open corrective actions. Month selector sorted newest-first, defaults to the latest row. Full-width odometer-style Days Since Last LTA centerpiece. Silent fallback to an 8-month sample dataset when no sheet is connected or the fetch fails, with a footer note swap instead of an error state. 4/2/1-column responsive grid.
The deployed Photo Displayer started as a personal archive problem: how do you turn a folder of trip photos into something people can actually explore, without hand-captioning every image or losing the geographic story?
The useful part is the system around the photos: import script, thumbnail and large-image outputs, manifest-driven rendering, location filters, map pins, and GPX route replay. The private deployment can use real images and GPS trails. The lab version keeps the interaction model but swaps in public placeholder photos and synthetic route context.
The product lesson is small but sharp: a memory product gets better when it preserves the path, not just the pictures.
Route replay makes photo galleries feel less random
When viewers can see where the images sit in the trip path, the gallery becomes a story instead of a shuffled grid.
Auto-generated manifests are enough to publish fast
The import pipeline should make the publish step feel mechanical: pick photos, run script, review output, ship.
Location filters beat chronological navigation for casual viewers
People tend to remember trips by place, not file order. The first useful grouping is destination.
2026 Shipped
Added a portfolio-safe version of the deployed photo experience at /lab/photo-displayer/. It preserves the core shape of the work: masonry gallery, filters, route context, and the travel-photo presentation system, while removing the real photo manifest, personal captions, and GPS history.
Bachelor Tracking is a small private app built for a high-friction planning job: get a group of people aligned on lodging, itinerary, money, and decisions without turning the group chat into the source of truth.
The deployed version is a static HTML app with Supabase behind it. It has guest access, admin mode, editable crew and itinerary data, expense splitting, per-person payment status, poll voting, and row-level security rules that limit destructive actions. It is deliberately plain because the workflow mattered more than the wrapper.
The public lab version removes the real Supabase project, admin email, links, people, and event data. What remains is the product shape: a single-purpose coordination tool that trades polish for speed and shared clarity.
A narrow private tool beats a general planning app for one-off events
When the workflow is specific enough, a tiny custom app can reduce confusion more than asking everyone to adopt a broader tool.
Supabase is enough backend for temporary coordination tools
The app needs shared state, light permissions, and a few relational tables, not a full product backend.
Expense state is the feature that keeps people returning
Itinerary details matter before the trip; per-person payment status is the durable utility.
2026 Shipped
Added a public-safe version at /lab/bachelor-tracking/ that mirrors the deployed app's major surfaces: overview, crew, itinerary, expenses, and polls, with synthetic rows only. The real Supabase URL, auth flow, admin identity, venue links, and participant data stay out of the portfolio route.
Want to build with me?
I'm a safety director transitioning into construction technology product management. The work in this lab is what I do when there's no committee to convince and no budget to justify.
I'm selectively open to the right full-time product role, and always interested in connecting with people building at the intersection of construction, safety, and technology.